Built for serious prop market players
Every feature in 1XP was designed around one question: what does a sharp player need to make a fast, confident, data-backed decision?
5-Layer Scoring System
Five weighted dimensions. One composite score. The same logic a sharp analyst runs, in milliseconds.
Trend Analysis
We measure how a player has performed against their prop line over the last 5 and 10 games, giving you an instant read on whether they're running hot or cold.
Momentum
Averages alone don't tell the full story. We track the direction of a player's recent output to detect rising streaks and slumps before the line catches up.
Matchup
Not all defenses are equal. We evaluate the opponent's defensive rating specifically for the stat type in question, not just overall team rankings.
Role Stability
A player averaging 30 points means nothing if their minutes fluctuate wildly. We score how consistent their role and usage has been going into this game.
Volatility
High variance is risk. We measure the standard deviation of recent performances so boom-or-bust players are flagged and confidence is adjusted accordingly.
All five layers combine into a composite 0–100 score that maps to a confidence tier and letter grade. Your instant read.
The data, explained in plain English
Every prop card includes a 2–3 sentence explanation. It reads the numbers so you don't have to interpret them yourself.
"LaMelo Ball is averaging 26.4 over his last 5 games against a Charlotte line of 24.5, a +8% edge. Sacramento ranks 28th in perimeter defense and is allowing 28.1 points to primary guards this month. Momentum is rising (+4.2 pts over last 3 games). The profile supports over."
All AI insights cite exact numbers. Never generic. Never hedged.
LaMelo Ball
24.5
Points
"LaMelo is averaging 26.4 over his L5 against this 24.5 line, a +8% edge. Sacramento ranks 28th in perimeter defense and is allowing 28.1 pts to primary guards this month. Momentum is rising. The profile supports over."
Your entire slate,
one screen
Every player card on the dashboard shows the prop line, confidence tier, letter grade, and L5 hit rate, before you even click. Scan the slate in seconds, then deep-dive on the ones that matter.
- Green = Strong Over signal
- Light green = Lean Over
- Gray = No Edge detected
- Amber = Lean Under signal
- Red = Strong Under signal
Example cards, live from the dashboard
Shai Gilgeous-Alexander
OKC vs BOS
Nikola Jokic
DEN vs PHX
LeBron James
LAL vs IND
Everything you need, nothing you don't
Live PrizePicks Lines
Today's NBA prop lines pulled automatically. Open the app and the slate is already there.
Game Log Table
Full season game-by-game breakdown with color-coded over/under hits. Patterns visible at a glance.
Sparkline Chart
A visual trend line overlaid on the prop line. See momentum and variance without reading a table.
Red Flag Alerts
When injury risk, role instability, or extreme volatility is detected, the card is automatically flagged.
Player Search
Search any NBA player by name and jump straight to their full analysis in one click.
Context Tags
Key situational tags — Back-to-Back, Home/Away, Pace, Rest. Auto-generated for every game.
Over Rate Tracker
Hit rate bars for the last 5 and 10 games. See immediately how consistently a player clears their line.
Season Averages
Current season stats in a single header bar. No extra tabs, no extra searches.
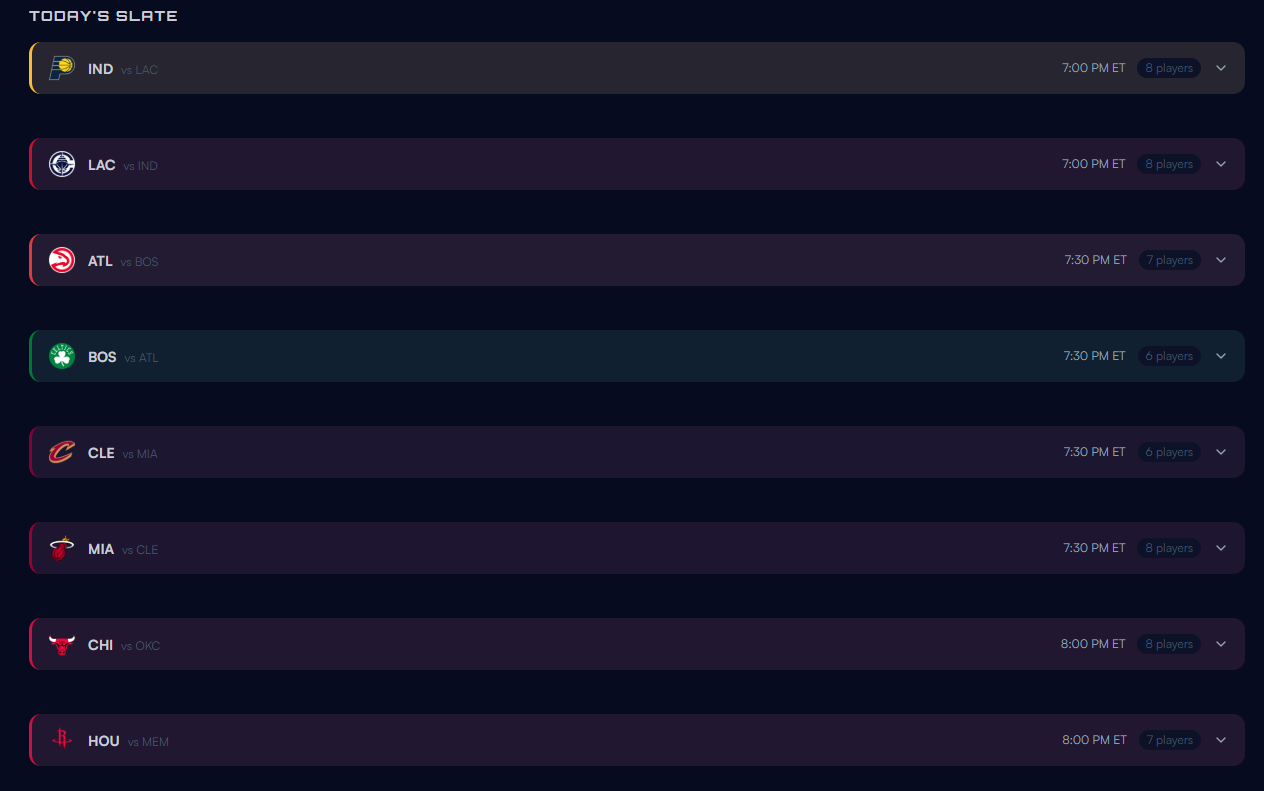
Today's slate, organized by team
The dashboard groups all players by team, sorted by game time. Expand any team, filter by prop type, click any player to run the full analysis.
- Sorted by tip-off time
- Filter by PTS / REB / AST / PRA
- One click to full player analysis
- Team colors + logos throughout